In the evolving landscape of health and fitness, understanding body composition has become a cornerstone of personal wellness strategies. Among the various metrics used to assess physical health, body fat percentage stands out as a critical indicator, often regarded as more insightful than traditional measures like body mass index (BMI). While BMI provides a rough estimate based on height and weight, it fails to distinguish between muscle mass and fat mass, leading to potential misclassifications—especially for athletes or individuals with higher muscle density. Body fat percentage, however, offers a nuanced view by quantifying the proportion of fat relative to total body weight, enabling a more accurate assessment of health risks and fitness progress.
The concept of body fat percentage is not new, but its prominence in public health discourse has grown significantly in recent decades. Historically, visual assessments and crude measurements like skinfold calipers were the norm, often yielding inconsistent results. Today, advancements in technology and a deeper understanding of human physiology have revolutionized how we measure and interpret this metric. From clinical settings to home environments, a variety of methods are now available, each with its own strengths and limitations. This article delves into the visual comparison charts that simplify body fat estimation for everyday use and explores the scientific methods that provide precise measurements, highlighting why this metric matters for overall health.
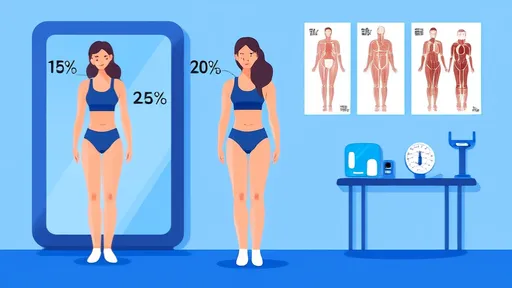
Visual body fat comparison charts have gained popularity as accessible tools for initial self-assessment. These charts typically feature images or illustrations of human bodies at different fat percentage ranges, categorized by gender and sometimes age. For men, common categories might include essential fat (2-5%), athletes (6-13%), fitness enthusiasts (14-17%), average (18-24%), and obese (25% and above). Women, due to physiological differences such as higher essential fat requirements for reproductive health, have different ranges: essential fat (10-13%), athletes (14-20%), fitness enthusiasts (21-24%), average (25-31%), and obese (32% and above). By comparing one's own physique to these images, individuals can get a rough idea of their body fat level without any equipment.
However, visual charts come with significant drawbacks. Human perception is subjective; factors like lighting, posture, muscle definition, and even psychological body image issues can skew comparisons. For instance, someone with a muscular build might appear to have higher body fat in a visual chart due to bulk, while another person with low muscle mass and higher fat could be misclassified as "average." Moreover, these charts often oversimplify the diversity of body types, failing to account for genetic variations in fat distribution—such as android (apple-shaped) versus gynoid (pear-shaped) patterns. As a result, visual estimates should be viewed as a starting point rather than a definitive assessment.
For those seeking accuracy, scientific methods of measuring body fat percentage offer reliable alternatives. Among the most accessible and widely used is bioelectrical impedance analysis (BIA). BIA devices, which range from handheld units to smart scales, work by sending a low-level electrical current through the body. Since fat tissue conducts electricity differently than lean tissue, the resistance encountered provides an estimate of body fat. These tools are convenient and non-invasive, making them popular for home use. However, their accuracy can be influenced by hydration levels, recent food intake, and skin temperature, so consistent conditions—such as measuring at the same time of day—are crucial for reliable trends.
Skinfold calipers represent another common method, particularly in fitness and clinical settings. This technique involves pinching folds of skin at specific sites—such as the abdomen, triceps, or thigh—and measuring their thickness with calipers. These measurements are then plugged into equations to estimate overall body fat. While cost-effective and portable, skindfold calipers require trained personnel to ensure precision, as improper pinching or site selection can lead to errors. Despite this, when performed correctly, they can provide reasonably accurate results, with error margins typically around 3-4%.
For gold-standard accuracy, methods like dual-energy X-ray absorptiometry (DEXA) scans and hydrostatic weighing are employed. DEXA scans, originally developed for bone density assessment, use low-dose X-rays to differentiate between fat, lean tissue, and bone mass with high precision. This method is highly regarded for its reliability and detailed regional analysis, but it requires specialized equipment and is often costly. Hydrostatic weighing, another reference method, involves submerging a person in water and measuring displacement to calculate body density and fat percentage. Although extremely accurate, it is impractical for routine use due to the need for specialized facilities and discomfort associated with the process.
Understanding why body fat percentage matters extends beyond aesthetics; it is deeply tied to health outcomes. Excessive body fat, particularly visceral fat surrounding organs, is linked to increased risks of chronic diseases such as type 2 diabetes, cardiovascular conditions, and certain cancers. Conversely, extremely low body fat—often seen in athletes or individuals with eating disorders—can disrupt hormonal balance, impair immune function, and lead to issues like osteoporosis. Thus, maintaining a healthy range is essential. For most adults, optimal body fat percentages are generally considered to be 8-19% for men and 21-33% for women, though these ranges can vary based on age and individual health factors.
Interpreting body fat measurements requires context. For example, two people with the same body fat percentage might have vastly different health profiles based on factors like fitness level, diet, and genetic predisposition. Regular monitoring, using consistent methods, can help track progress in weight management or fitness programs. Trends over time are often more informative than single measurements, as they account for natural fluctuations and provide insight into the effectiveness of lifestyle changes.
In conclusion, while visual body fat comparison charts offer a user-friendly introduction to body composition, they lack the precision needed for serious health assessment. Scientific methods, from BIA to DEXA scans, provide valuable data that, when interpreted correctly, can guide personalized health strategies. As awareness grows, integrating these tools into regular health check-ups could empower individuals to make informed decisions, moving beyond weight-centric approaches to embrace a more holistic view of wellness. Ultimately, body fat percentage is not just a number—it's a window into one's health journey, reflecting the balance between nutrition, activity, and overall well-being.
By /Aug 25, 2025

By /Aug 25, 2025

By /Aug 25, 2025

By /Aug 25, 2025
By /Aug 25, 2025

By /Aug 25, 2025

By /Aug 25, 2025

By /Aug 25, 2025

By /Aug 25, 2025

By /Aug 25, 2025

By /Aug 25, 2025

By /Aug 25, 2025
By /Aug 25, 2025

By /Aug 25, 2025
By /Aug 25, 2025

By /Aug 25, 2025

By /Aug 25, 2025
By /Aug 25, 2025

By /Aug 25, 2025

By /Aug 25, 2025